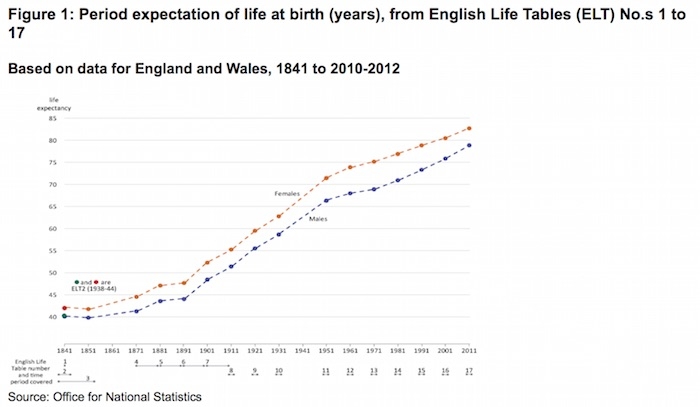
Life expectancy at birth has increased by nearly 3 years per decade over the last 100 years, new data has shown.
The figures were revealed in the decennial life tables for England and Wales, published by the Office for National Statistics today.
For males, life expectancy at birth increased from 51 years in 1910-1912 to 79 years in 2010-12, while for females it increased from 55 to 83 years.
Much of this increase is due to improvements in infant and child mortality in the first half of the 20th century, while gains in life expectancy at older ages have mainly occurred in the last 50 years, the ONS stated. People aged 60 could expect to live around 9 years longer in 2010-2012 than 100 years earlier.

For both men and women, life expectancy at age 60 has increased by around 9 years since 1910-12. The gains in life expectancy at older ages have mainly occurred in the last 50 years, particularly for men.
The tables showed that female life expectancy is higher than male life expectancy at every age, although the differential decreases by age; at birth a female would have had an extra 3.8 years to live compared to a male, but by age 60 this had decreased to 2.8 years.
{desktop}{/desktop}{mobile}{/mobile}
Based on the mortality experience for 2010-12 analysed in this life table 20% of males and 31% of females are expected to survive to celebrate their 90th birthdays.
These tables are the seventeenth in the series which began in 1841. They provide period life expectancy for males and females by single year of age for the 3-year period centred on a census. They have been constructed based on the mortality experience of the population of England and Wales during the 3 years 2010, 2011 and 2012.

