Wednesday, 27 March 2013 10:10
Signs of consumers saving more as UK GDP falls again
The latest GDP figures suggest the economy shrank as expected in the fourth quarter of 2012 but there are signs that consumers are saving more.
The Office for National Statistics says that UK gross domestic product in volume terms was estimated to have decreased by 0.3 per cent between the third and fourth quarter of 2012.
The figure was unrevised from the previous estimate. In current prices GDP was also estimated to have decreased by 0.3 per cent for the same period. The figures suggest a fall back after the Olympics last summer and suggest an economy struggling to find growth.
Economists have predicted a "triple dip" for the economy as the UK falls back into recession after a short period of growth.
On the more positive side, household final consumption expenditure increased by 0.4 per cent in volume terms in the latest quarter revised up from the 0.2 per cent increase previously estimated and there were signs that the service sector held up better than other sectors.
Among the main contributors to the decrease in GDP in the latest quarter were gross fixed capital formation which fell by 0.2 per cent in volume terms and the £6.0 billion net trade deficit, which follows a £5.3 billion net trade deficit in the previous quarter.
{desktop}{/desktop}{mobile}{/mobile}
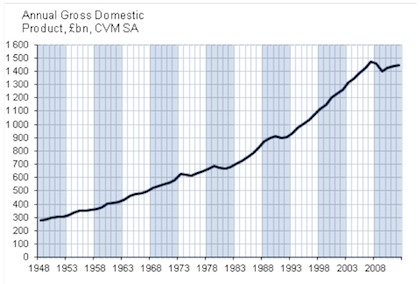
GDP in volume terms increased by 0.2 per cent when comparing the fourth quarter of 2012 with the fourth quarter of 2011. Between the years 2011 and 2012, GDP in volume terms increased by 0.3 per cent. ONS has released long term GDP growth figures (see table) to show the growth picture since just after the Second World War.
The households' saving ratio was estimated to be 7.1 per cent in 2012, the highest since the 1997 estimate of 8.1 per cent.
Real household disposable income increased by 2.1 per cent between 2011 and 2012. This is the highest growth since 2003 when it rose by 2.7 per cent.
The largest contributions to the increases in the households' saving ratio and real household disposable income were an estimated £20.1 billion increase in wages and salaries in 2012 compared with 2011.
This page is available to subscribers. Click here to sign in or get access.