The number of unemployed men was 1.51 million in the three months to March 2012, down 42,000 from the three months to December 2011. The number of unemployed women was 1.12 million in the three months to March 2012, down 3,000 from the three months to December 2011. Vacancies showed a small decline.
The number of people unemployed for over one year was 887,000 in the three months to March 2012, up 27,000 from the three months to December 2011. The number of people unemployed for over two years was 428,000 in the three months to March 2012, up 5,000 from the three months to December 2011.
The Office for Natinal Statistics, which produces the UK employement figures, als says that the unemployment rate for the European Union (EU) was 10.2 per cent of the economically active population in March 2012. The EU country with the highest unemployment rate was Spain, at 24.1 per cent, and the EU country with the lowest unemployment rate was Austria, at 4 per cent. The unemployment rate for Japan was 4.5 per cent in March 2012. The unemployment rate for the United States was 8.1 per cent in April 2012.
Young people in the labour market
In the three months to March 2012, there were 3.63 million 16 to 24 years olds in employment, up 2,000 from the three months to December 2011. There were 2.64 million economically inactive. The unemployment rate for 16 to 24 year olds was 21.9 per cent in the three months to March 2012, down 0.3 percentage points from the three months to December 2011.
Regional Labour Market, May 2012
• Employment rate highest in the South East and East of England (both 74.9 per cent) and lowest in the North East (66.6 per cent)
• Unemployment rate highest in the North East (11.5 per cent) and lowest in the South East (6.2 per cent)
• Inactivity rate highest in London (25.2 per cent) and lowest in the East of England (19.6 per cent)
• Claimant Count rate highest in the North East (7.6 per cent) and lowest in the South East (3.1 per cent)
ONS also publishes estimates of employment by both country of birth and by nationality. The number of non-UK born people in employment is greater than the number of non-UK nationals in employment, as the non-UK born series includes many UK nationals.
The estimates relate to the number of people in employment rather than the number of jobs. These statistics have sometimes been incorrectly interpreted as indicating the proportion of new jobs that are taken by foreign migrants, says ONS.
Its latest figures show that the number of UK nationals in employment was 26.59 million in the three months to March 2012, down 43,000 on a year earlier. The number of non-UK nationals in employment was 2.55 million, up 49,000 from a year earlier.
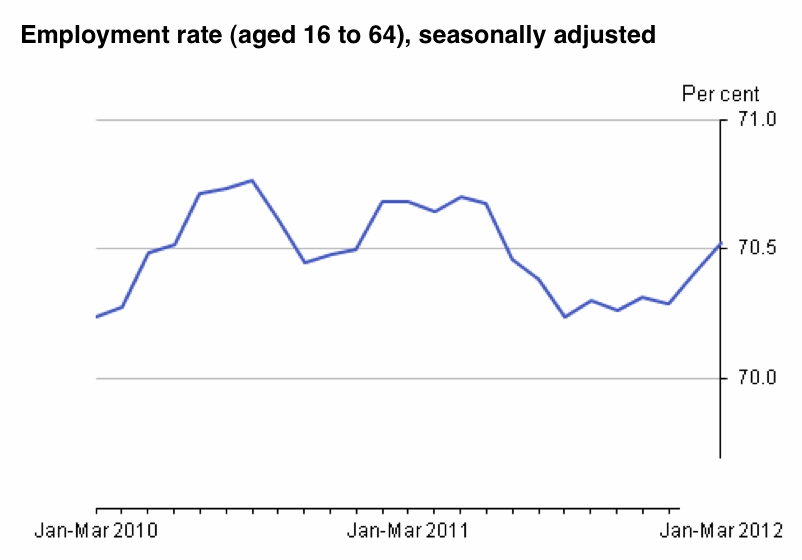
The employment rate for UK nationals aged from 16 to 64 was 70.7 per cent in the three months to March 2012, unchanged on a year earlier. The corresponding employment rate for non-UK nationals was 66.3 per cent, down 1.4 percentage points on a year earlier.
The number of UK born people in employment was 25.08 million in the three months to March 2012, down 8,000 on a year earlier. The number of non-UK born people in employment was 4.06 million, up 16,000 from a year earlier.

